Blog
Dec 7th, 2025
Shadow Cursors →
Getting back into creative coding with a project that replaces the standard cursor with flying shadows.

Jan 9th, 2025
Million Pixel Dash →
How fast can you scroll through a million pixels? Get your fingers warmed up becuase they're about to get a work out
Jan 4th, 2025
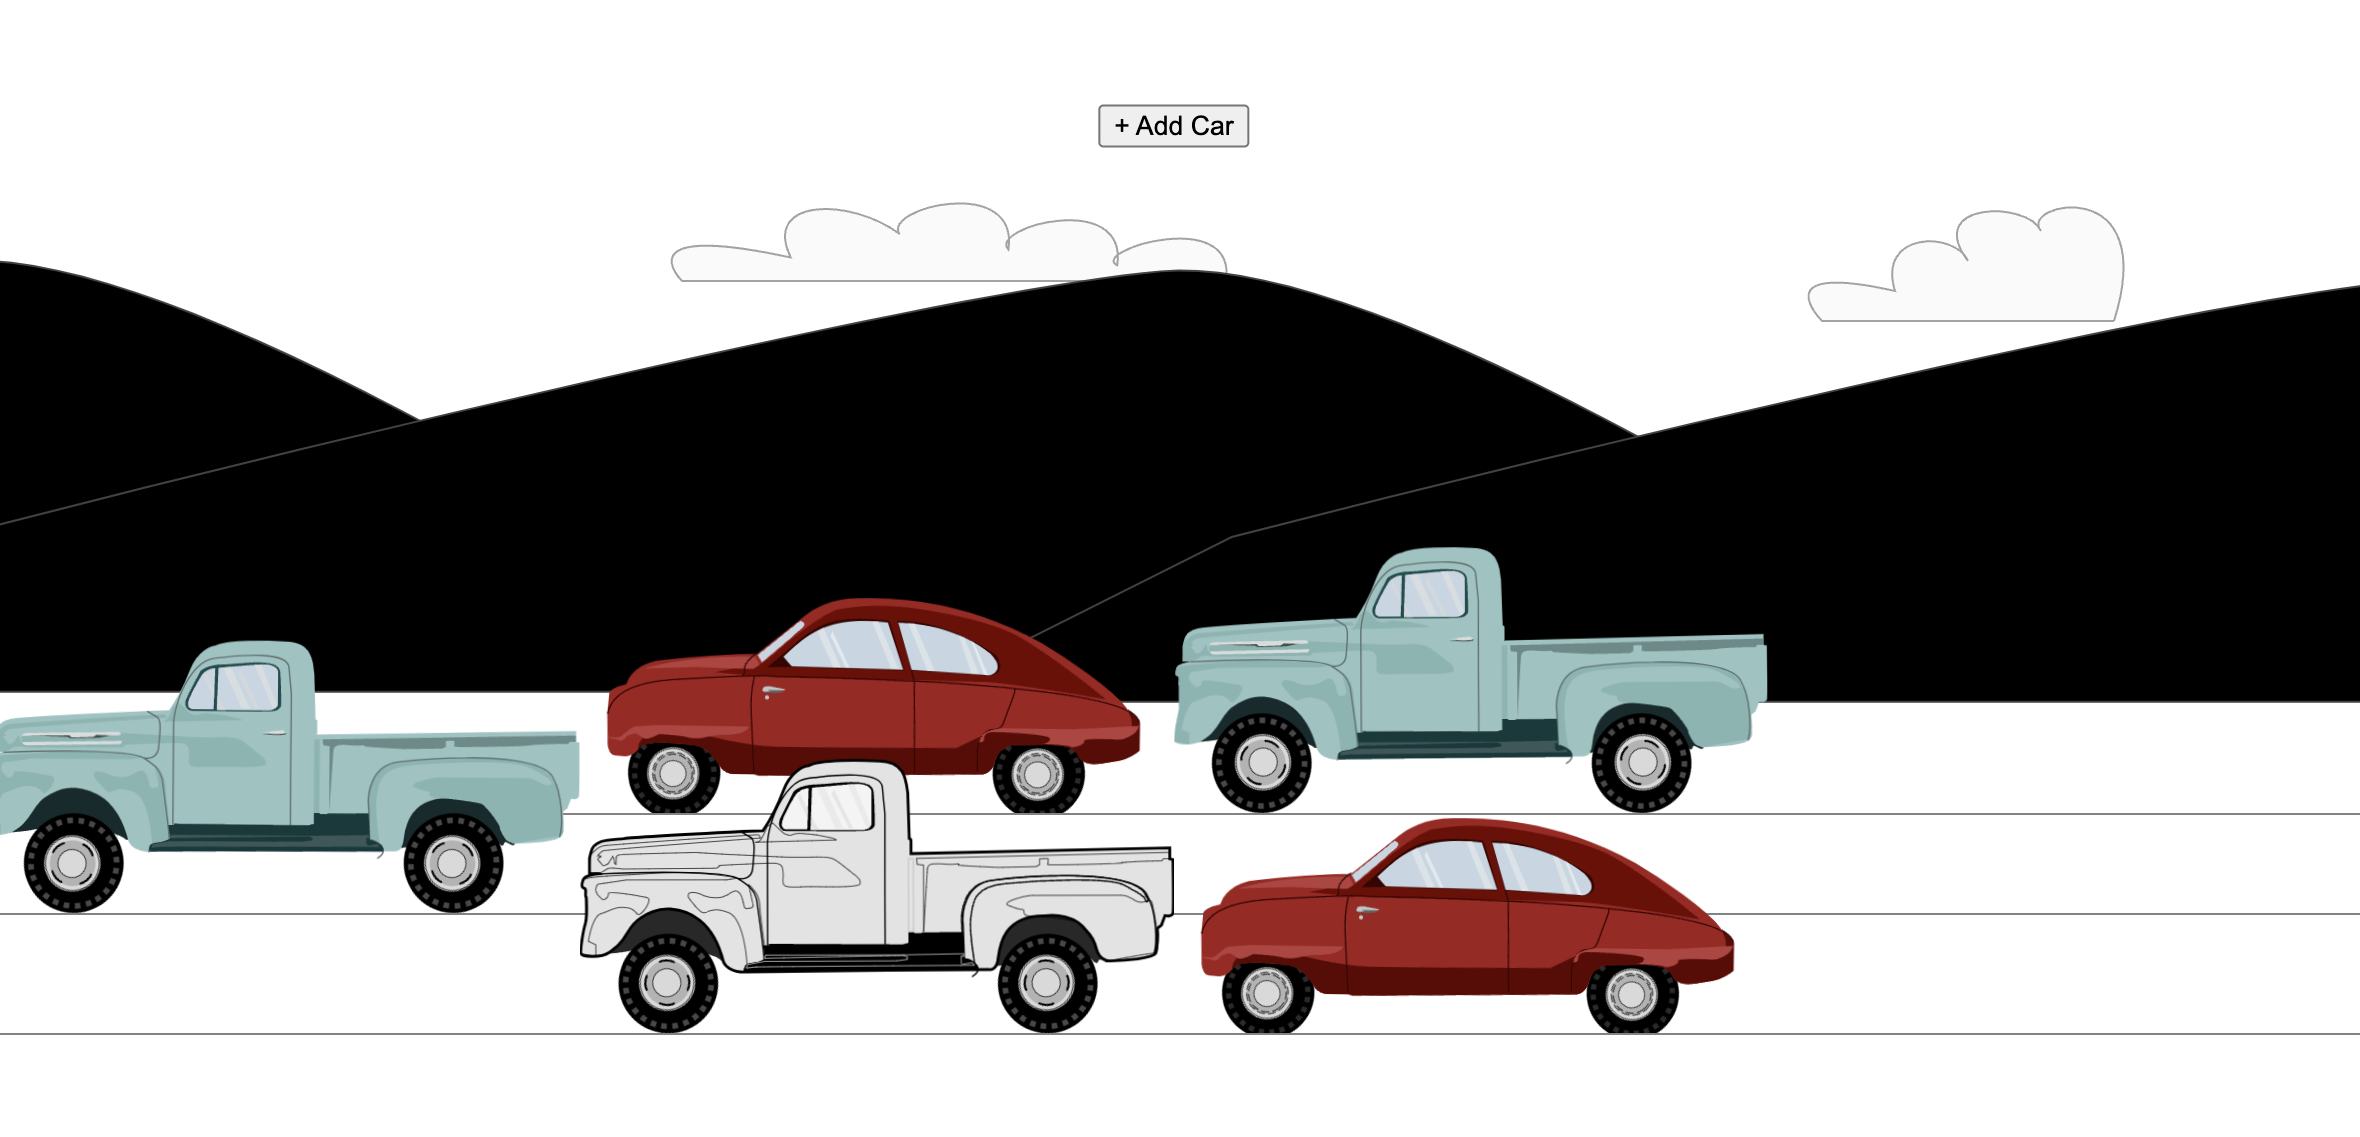
Traffic Jam: SVG Animation →
Dipping my toes into the world of SVG animations, I created a generative traffic jam simulation.
Dec 29th, 2024
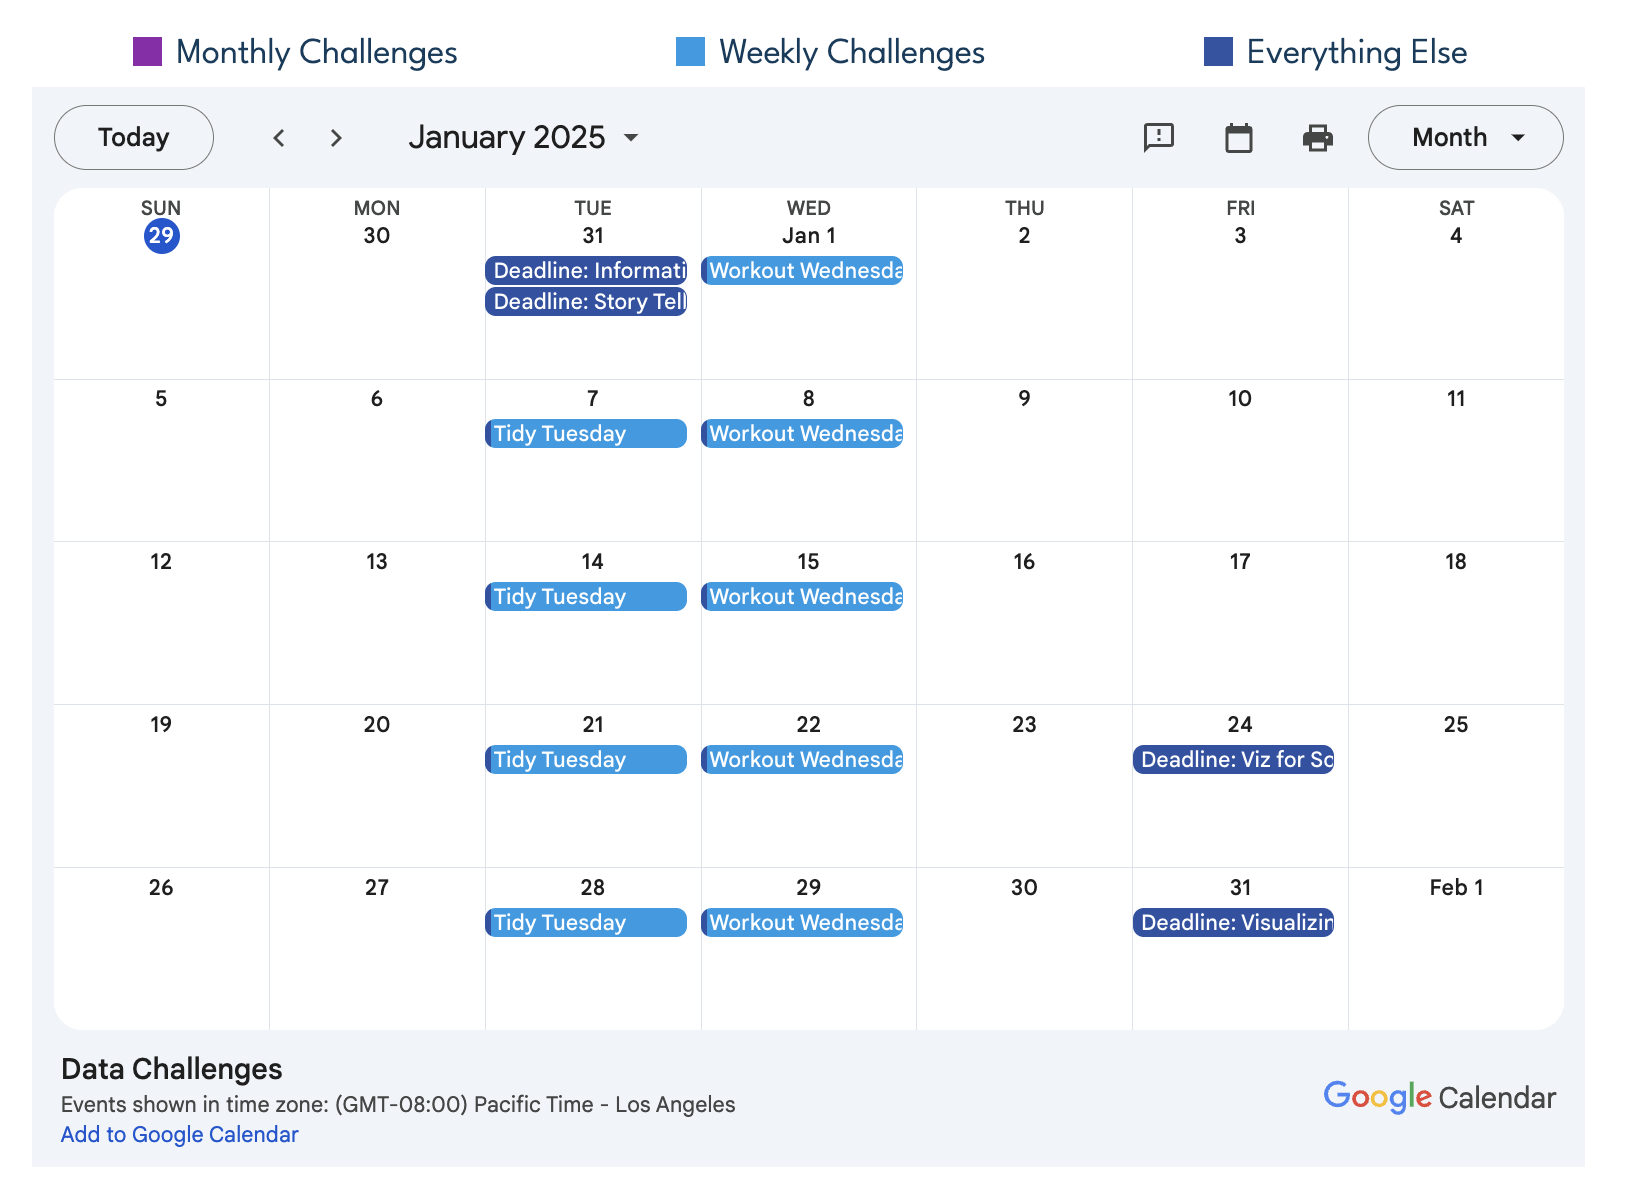
Data Challenge Calendar →
One of my 2025 New Year's resolution is to build more data visualizations and more importantly, get comfortable with sharing my work publicly. To that end, there are many great challenges and competitions related to data and data viz on Twitter/ Bluesky but I was having difficulty keeping track of everything- so I made a calendar to keep tabs on everything that strikes my fancy.
Dec 14, 2024
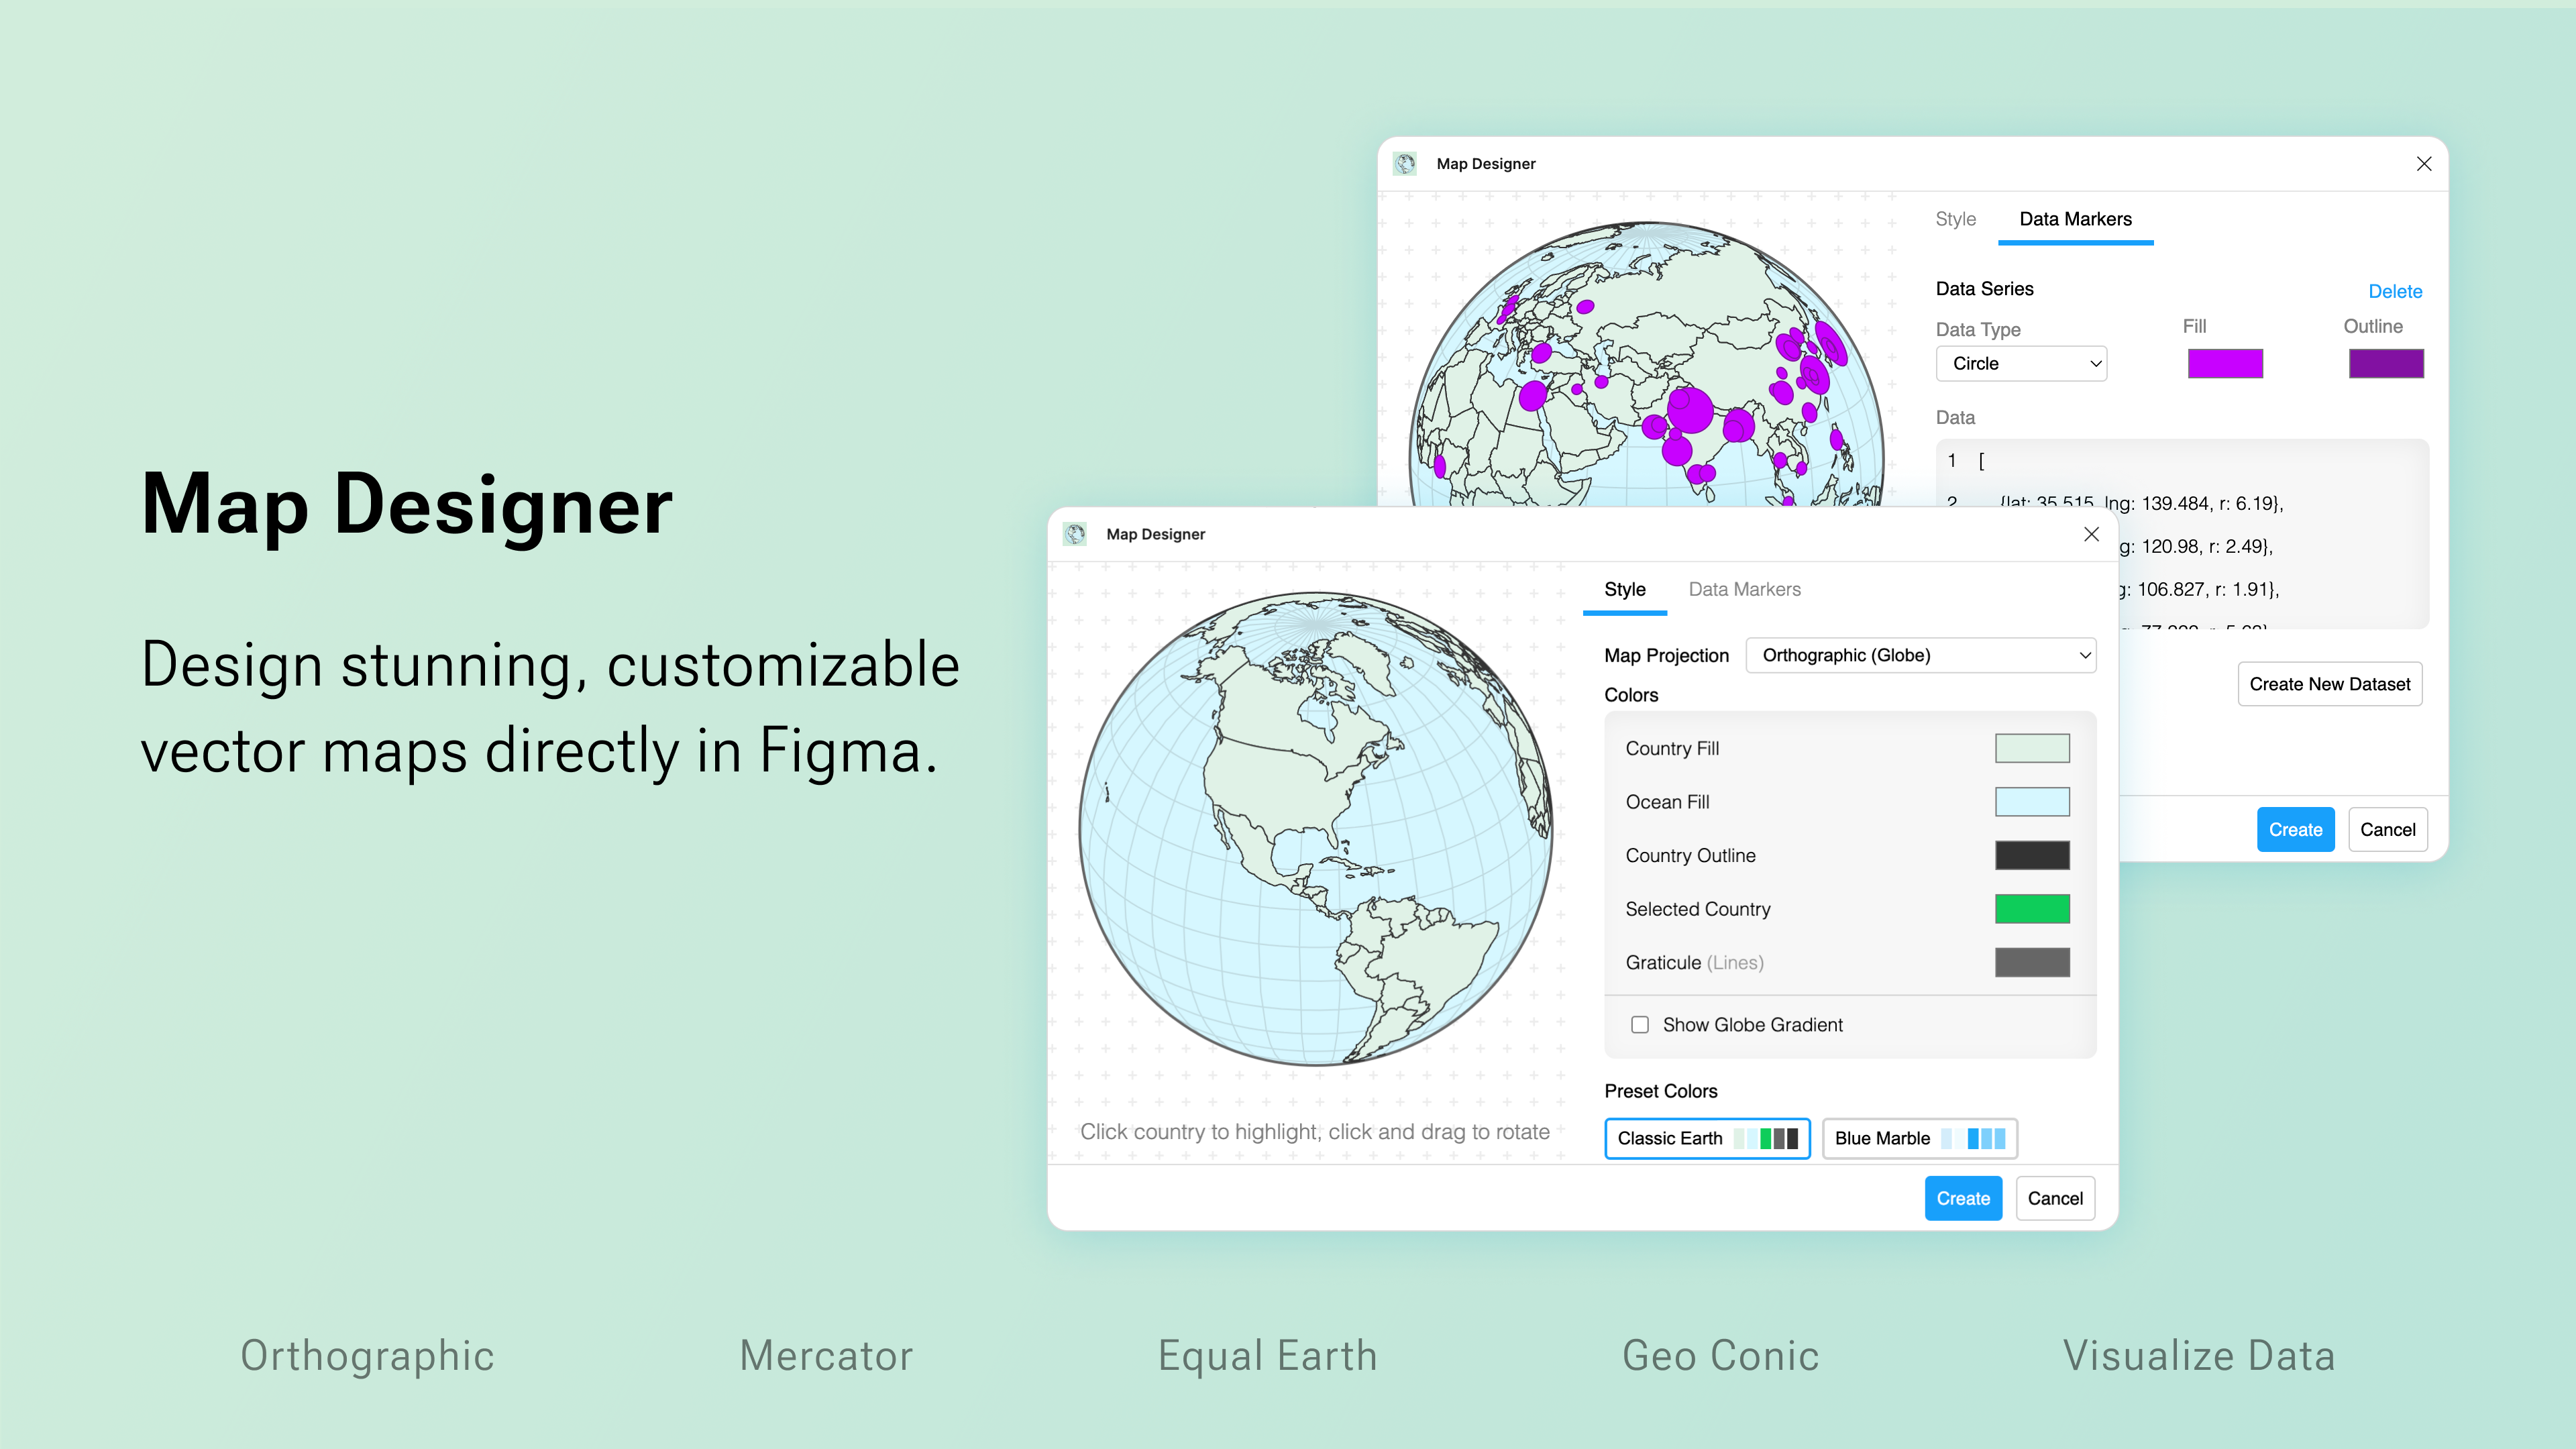
Map Designer: A Figma Plug In →
Designing and coding a Figma Plug In that makes creating and tweaking maps within Figma faster and easier. Created using d3-geo and javascript, Map Designer simplifies the process of creating data-driven maps directly in Figma.
Dec 9, 2024
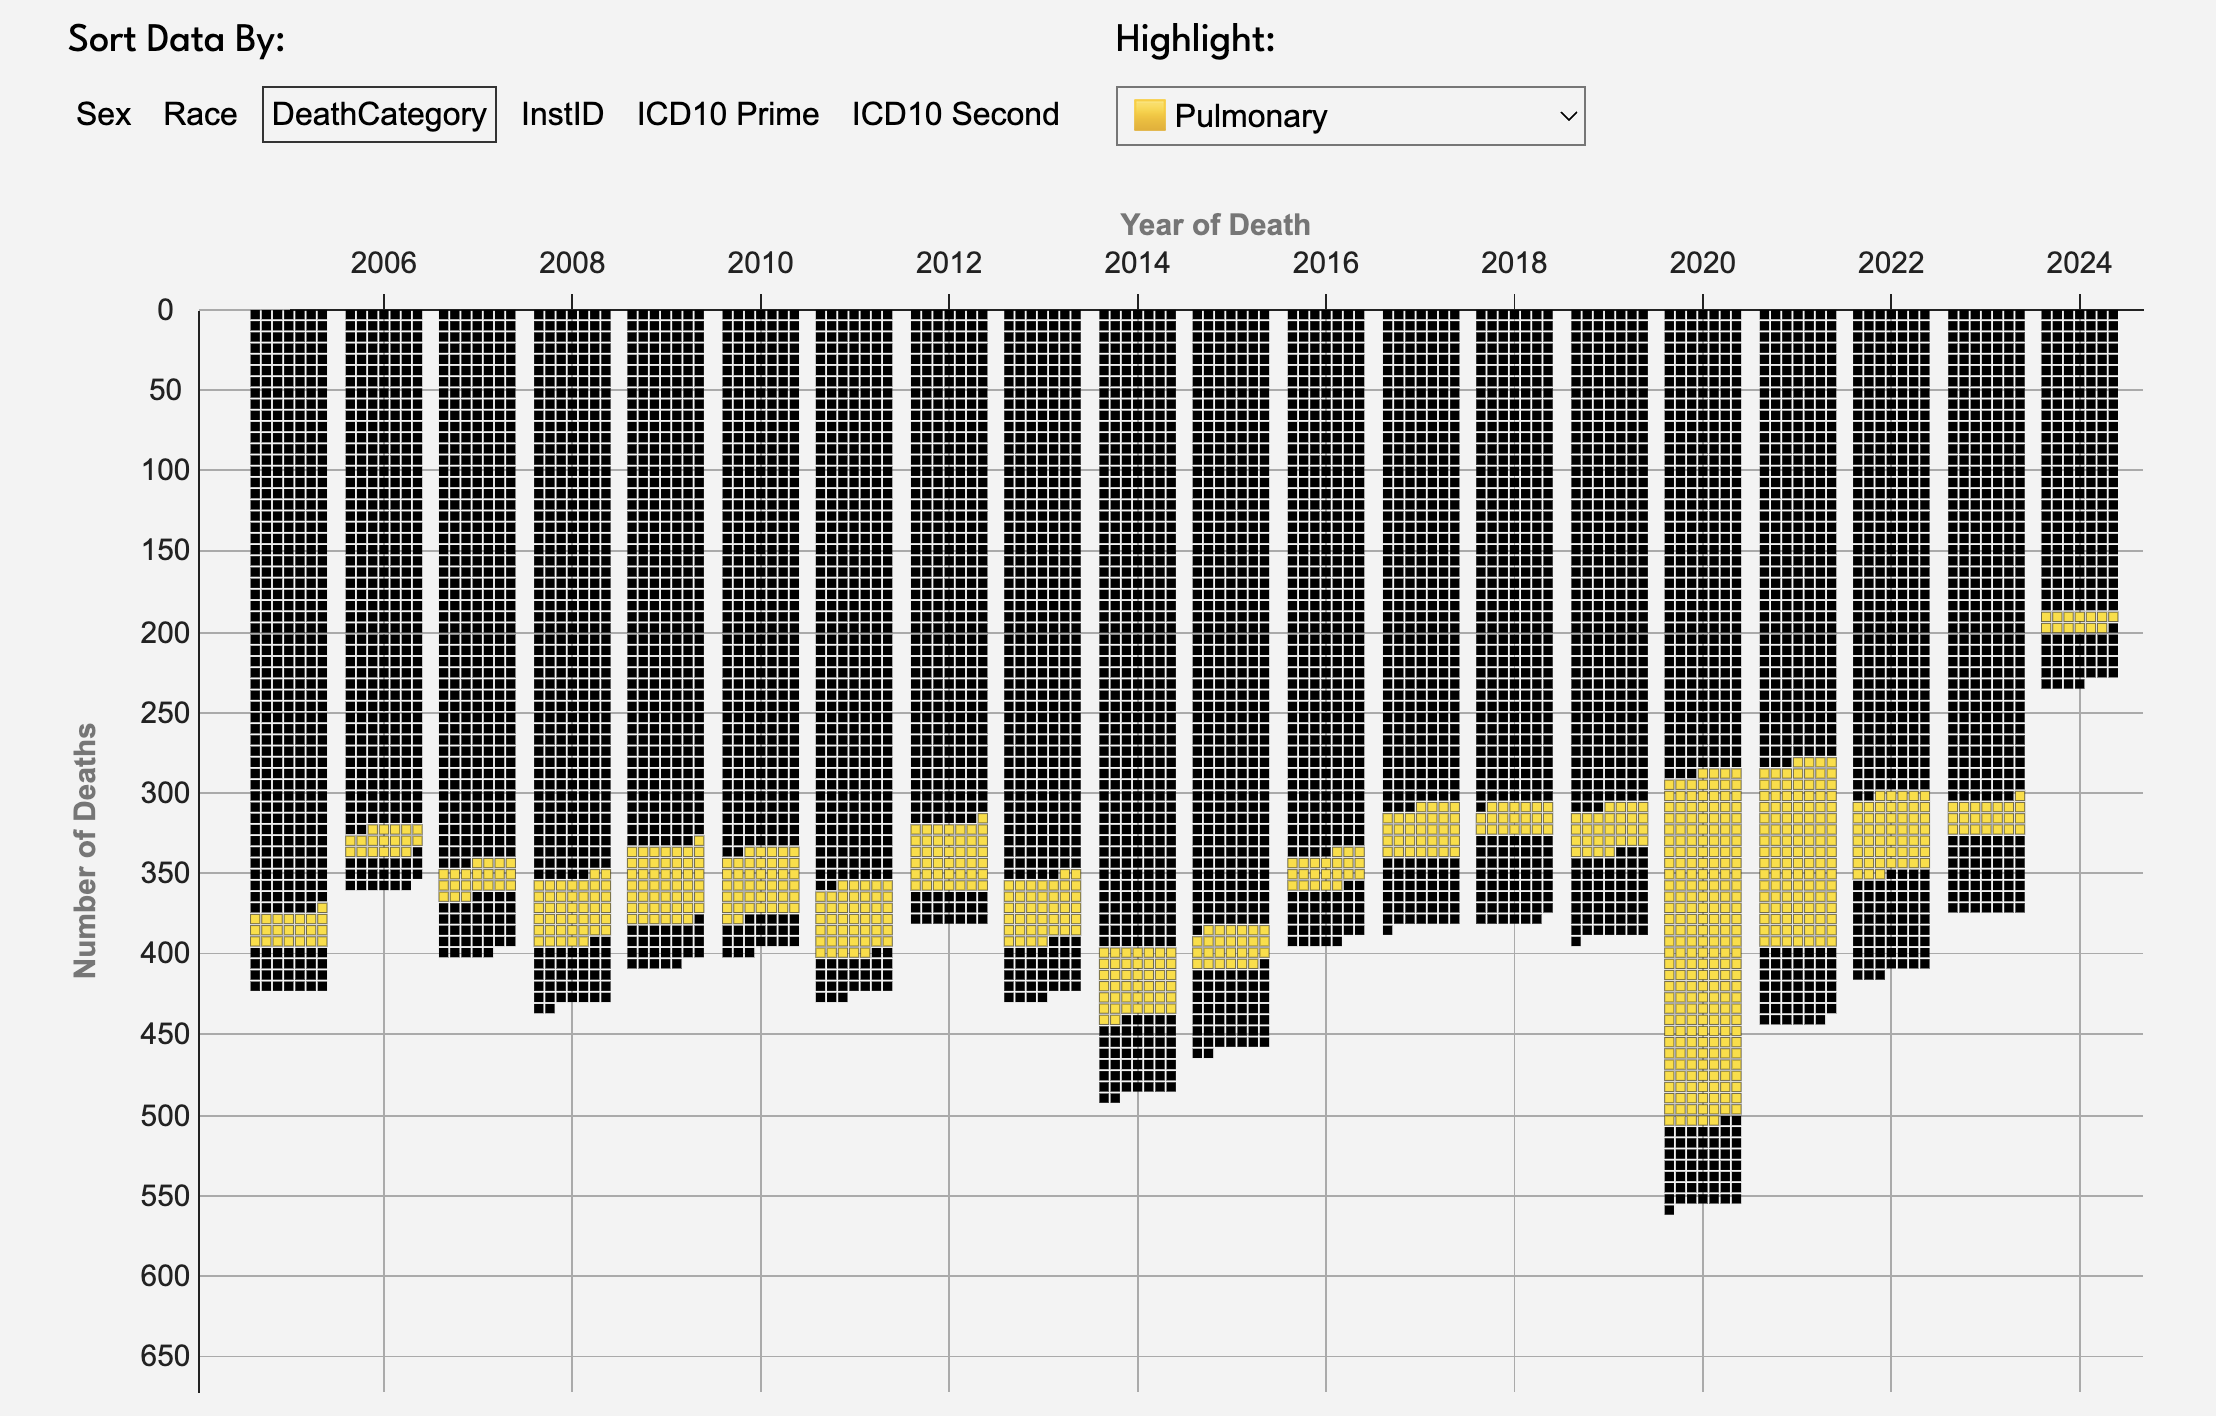
Visualizing Federal Inmate Deaths →
Using data from The Data Liberation Project, this page allows you to explore the Federal Inmate Death dataset and filter the data based on several variables in the dataset.
Dec 4th, 2024
Creative Coding: In Review →
My first time working with GSAP, I made a small animation to capture that feeling of the year passing you by for Wednesday's creative coding.

Dec 3rd, 2024
🚧 Color Spaces 🚧 →
Still a work in progress, this is an exploration into color pickers and color gamuts

November 15, 2024
Wrong Answers Only: Scantron →
Do NOT read the question, checking your work is NOT allowed. An overly faithful reproduction of a multiple choice test form that lets you bubble things in to your hearts content
